Mark Joseph Middendorf
Location
Cincinnati
United States
Project
SQL, Python, BI
Analytics Dashboard
01
2026
SQL, Python, BI, Data Analysis
Turn Excel roster exports into clear enrollment insights across 3 cities and 40 studio locations.
Intake: Excel rosters upload into a SQL database
Analysis: SQL & Python
Delivery: password-protected Python dashboard
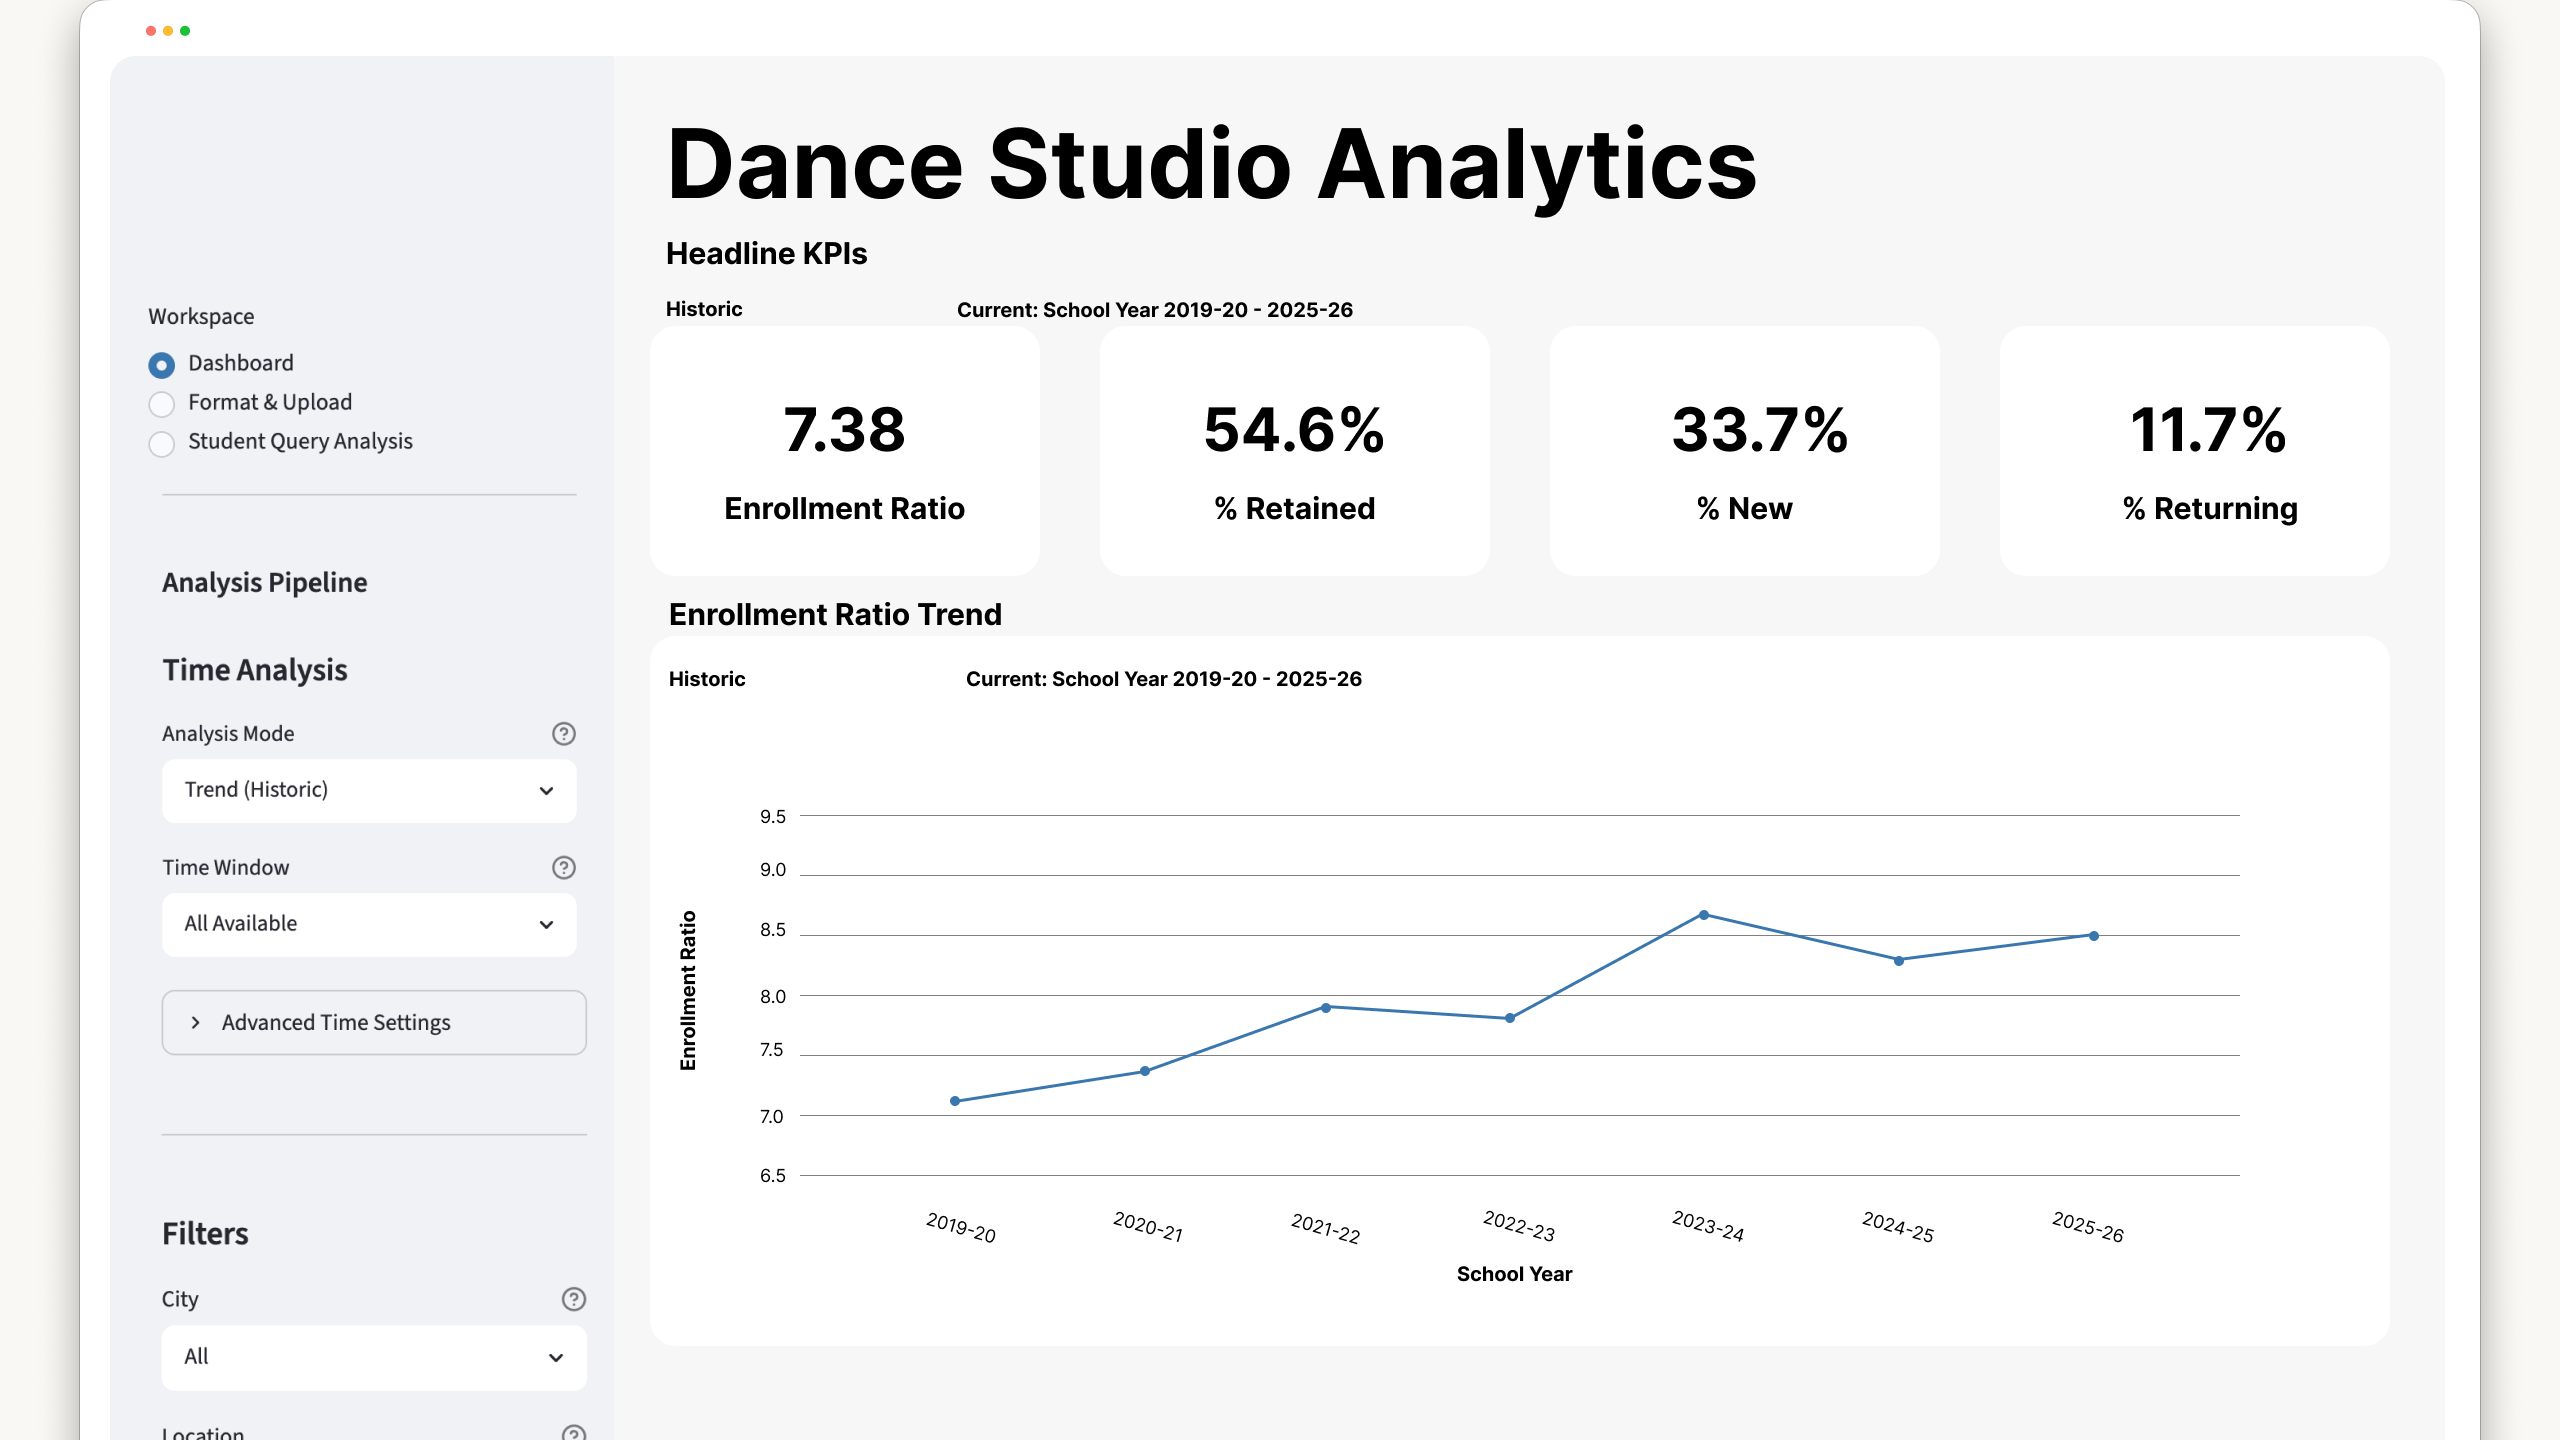
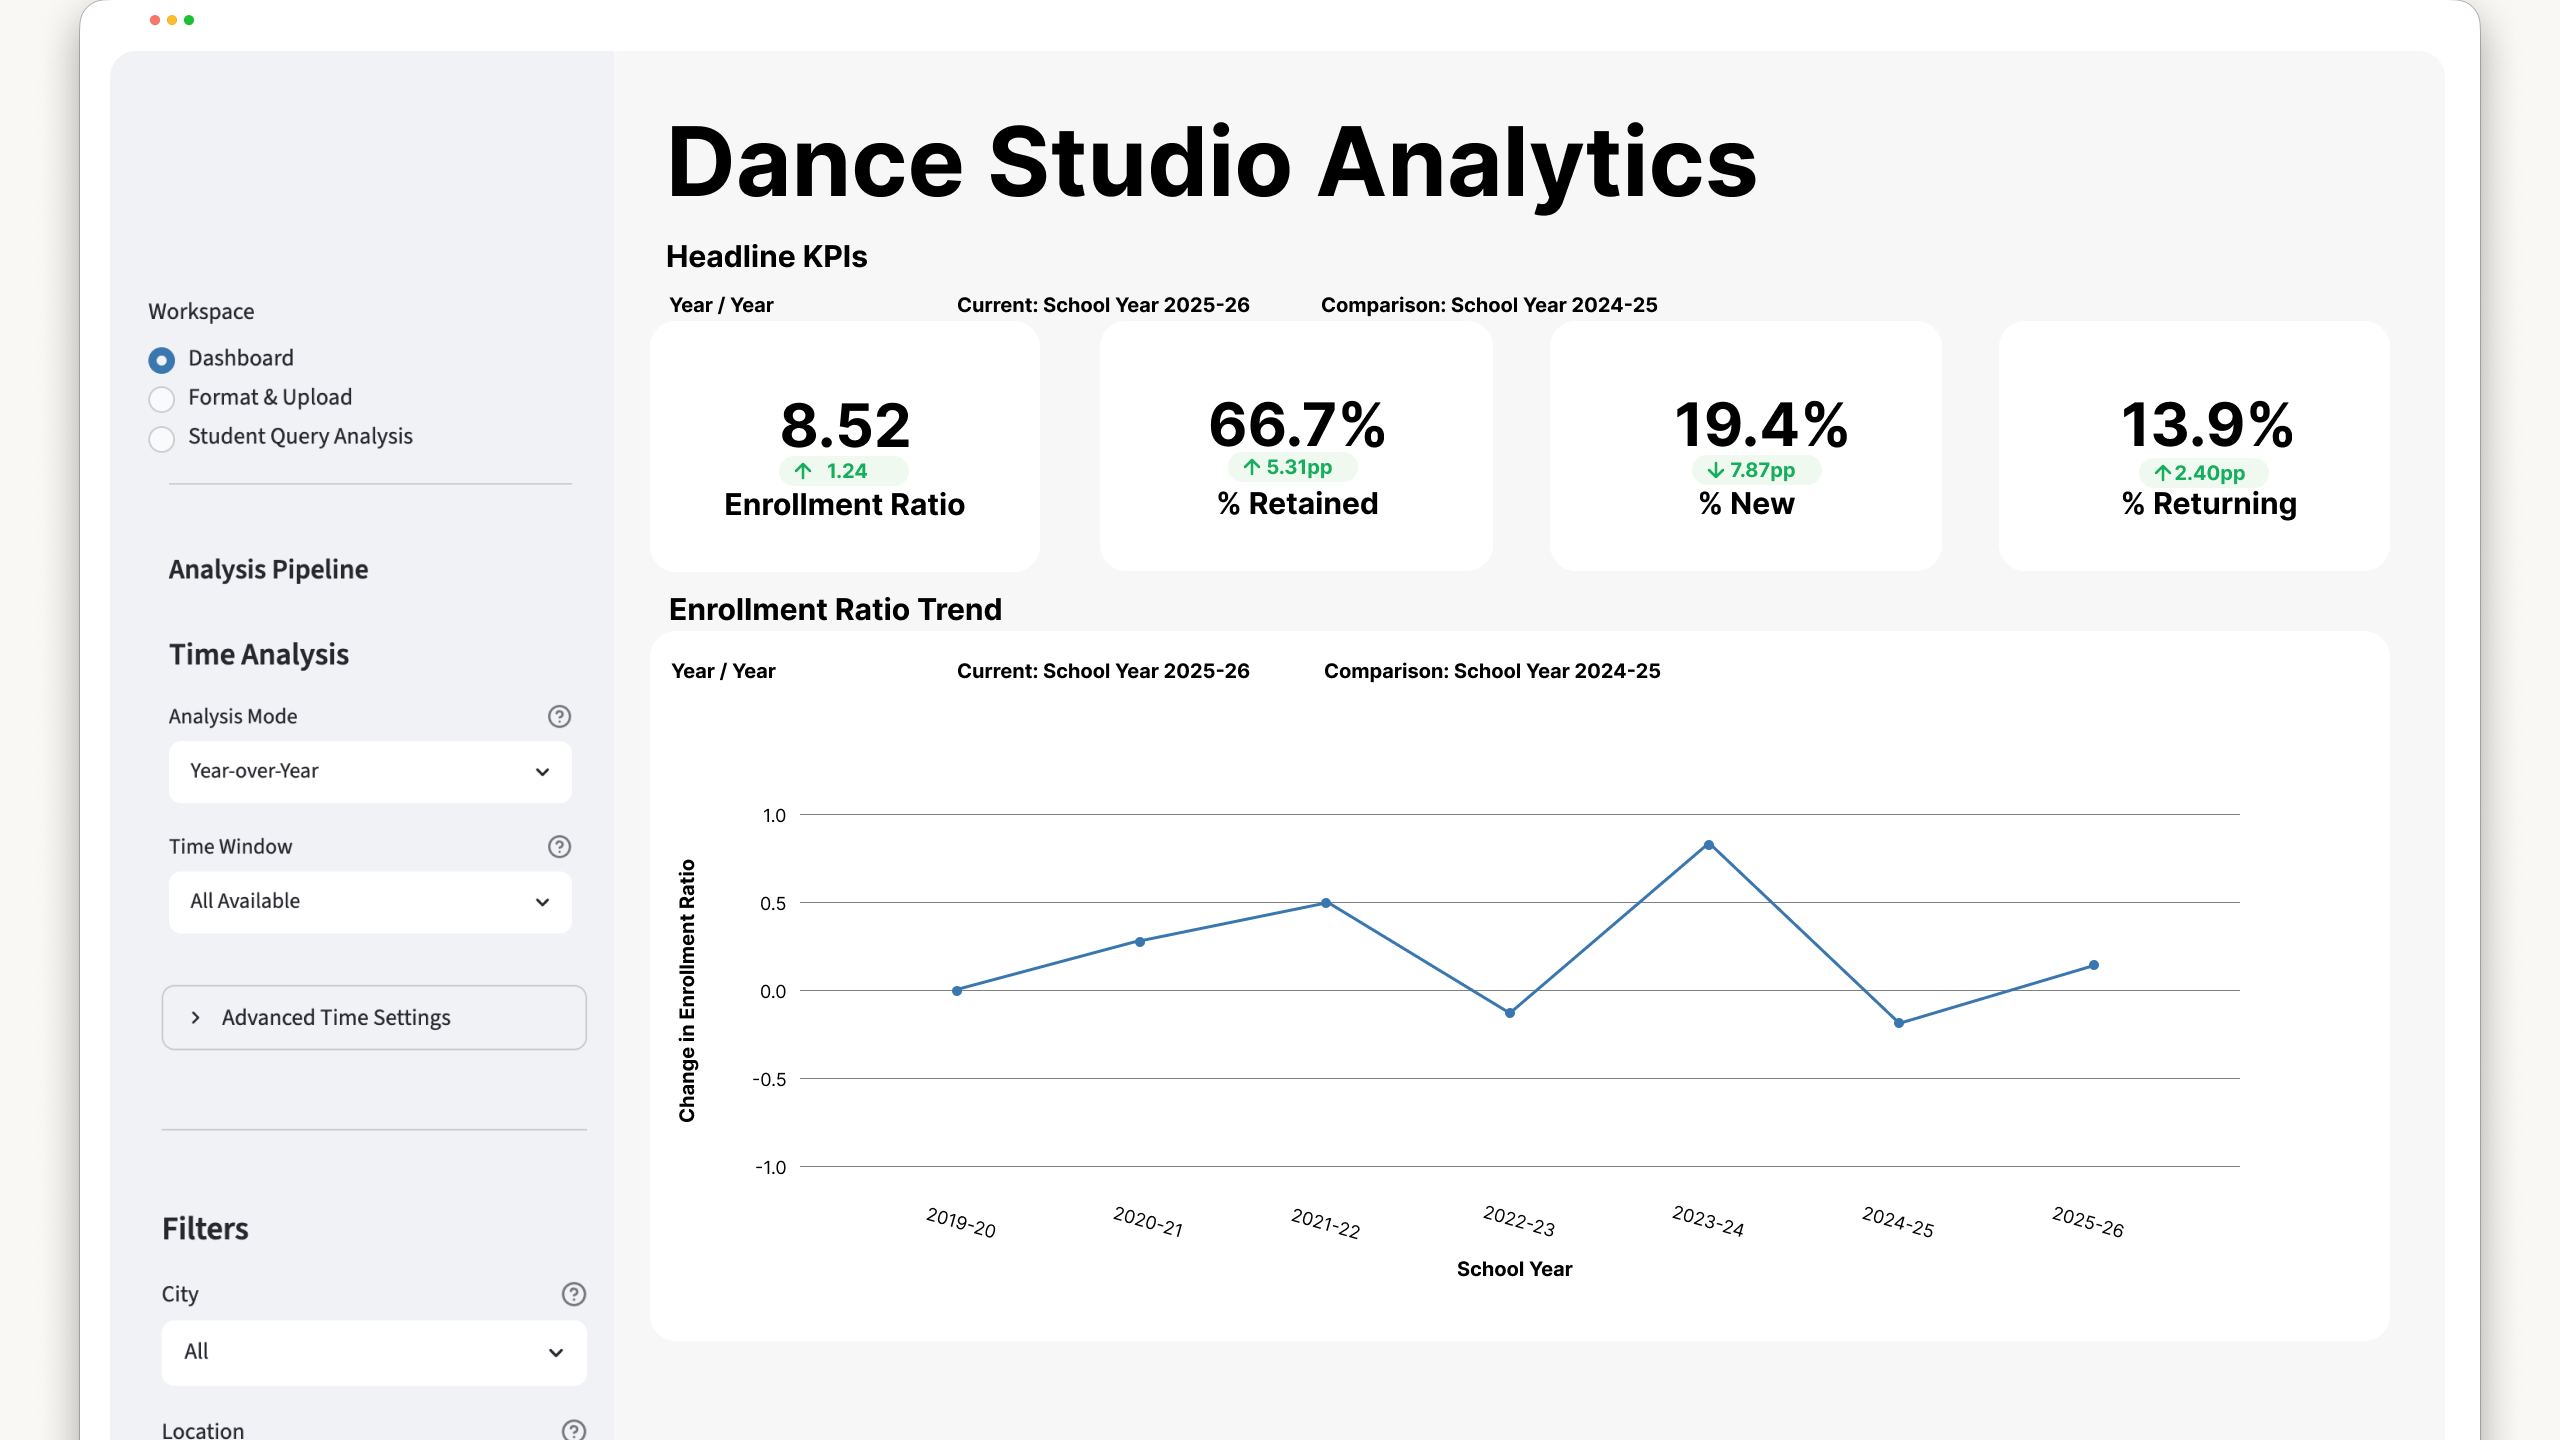
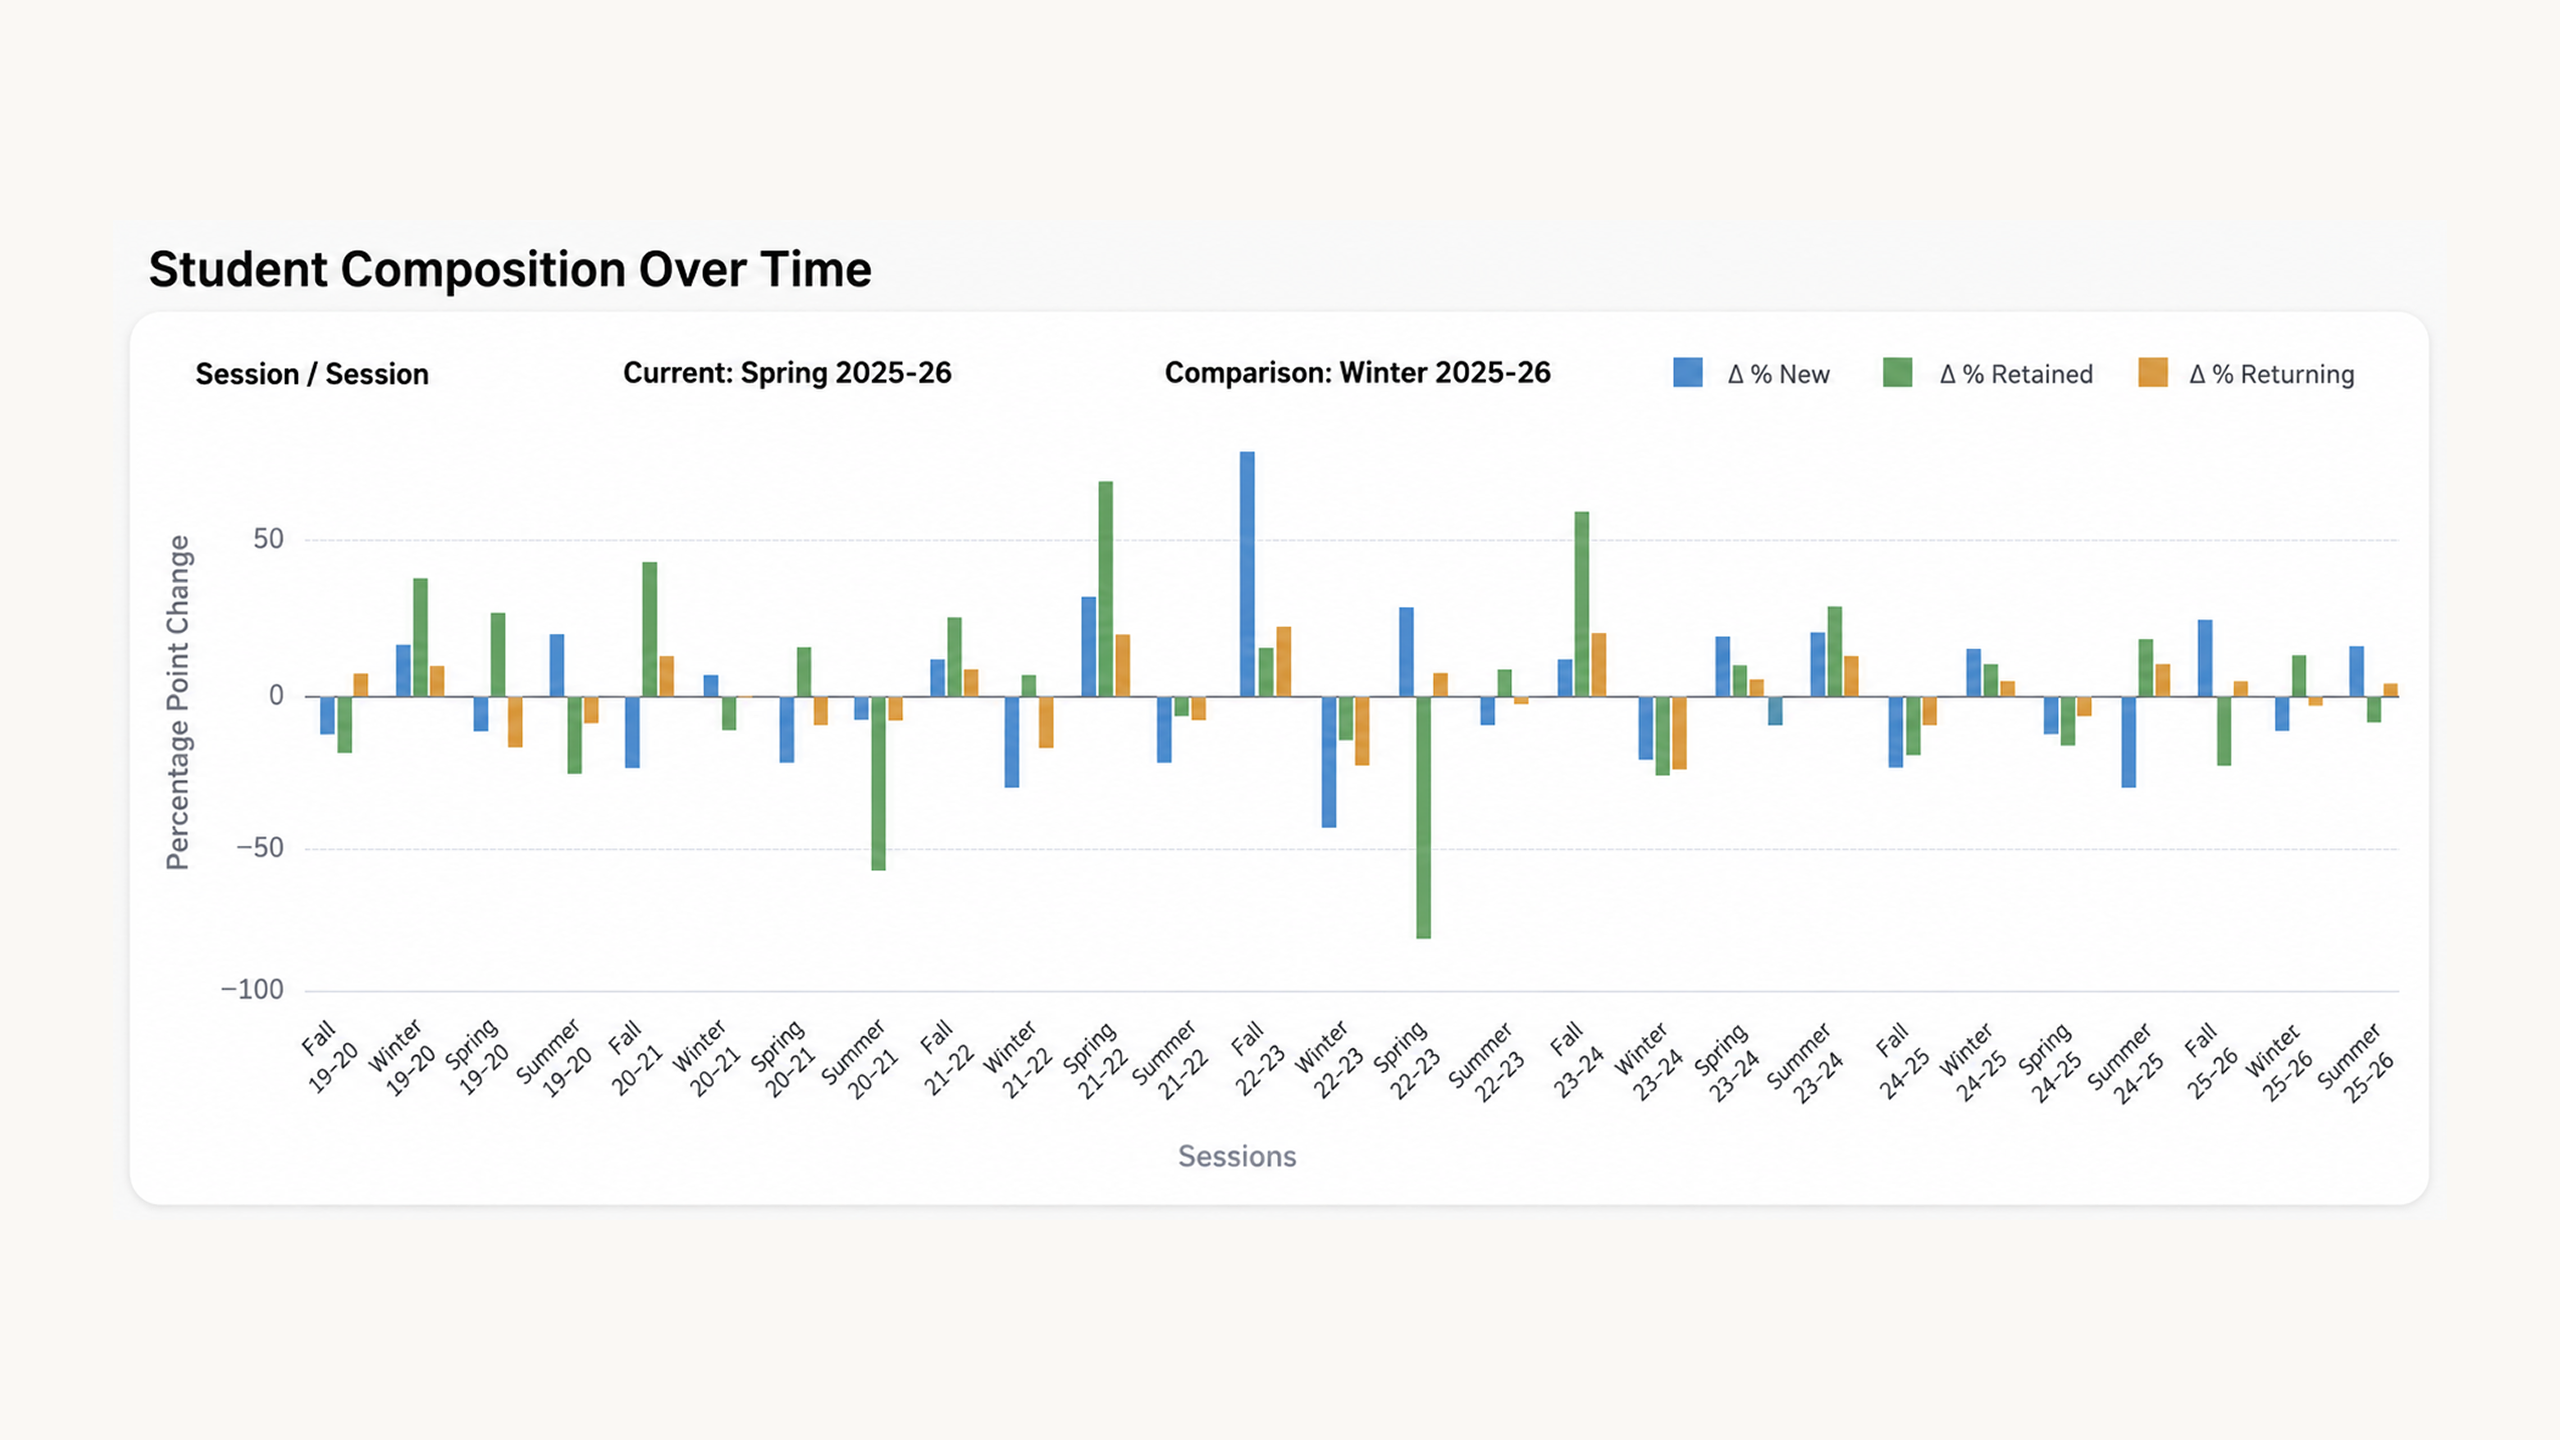
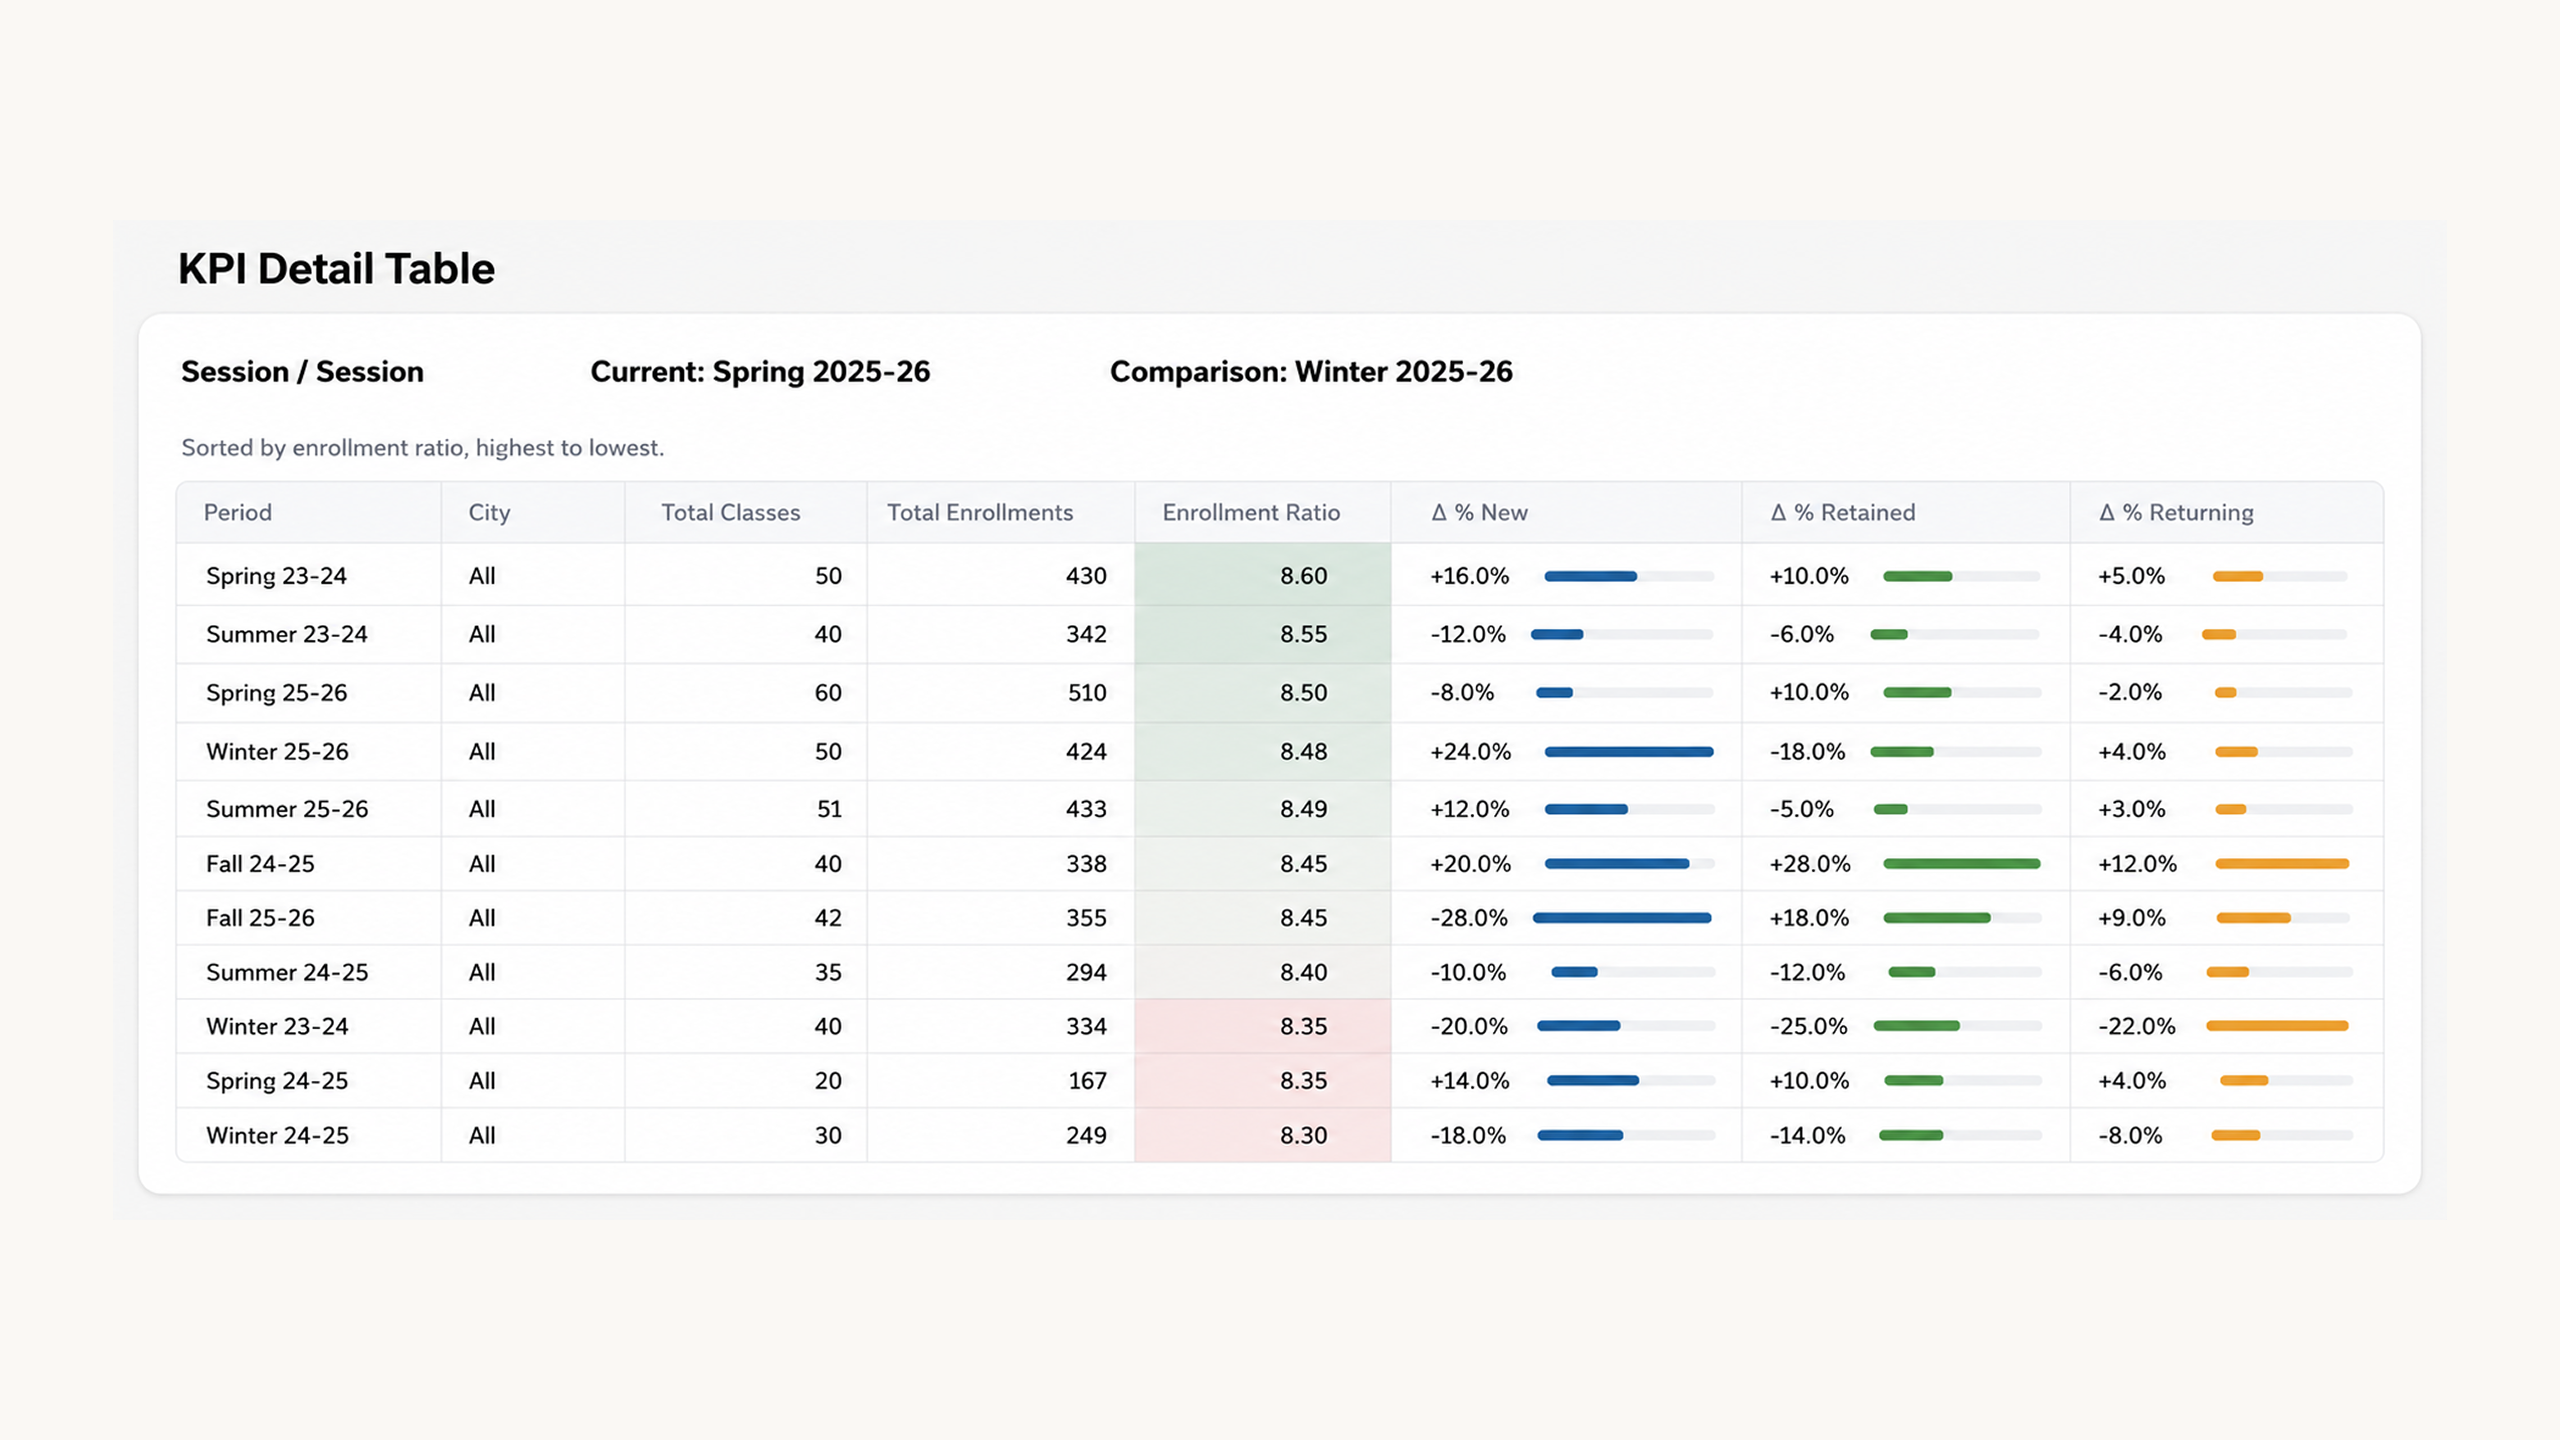
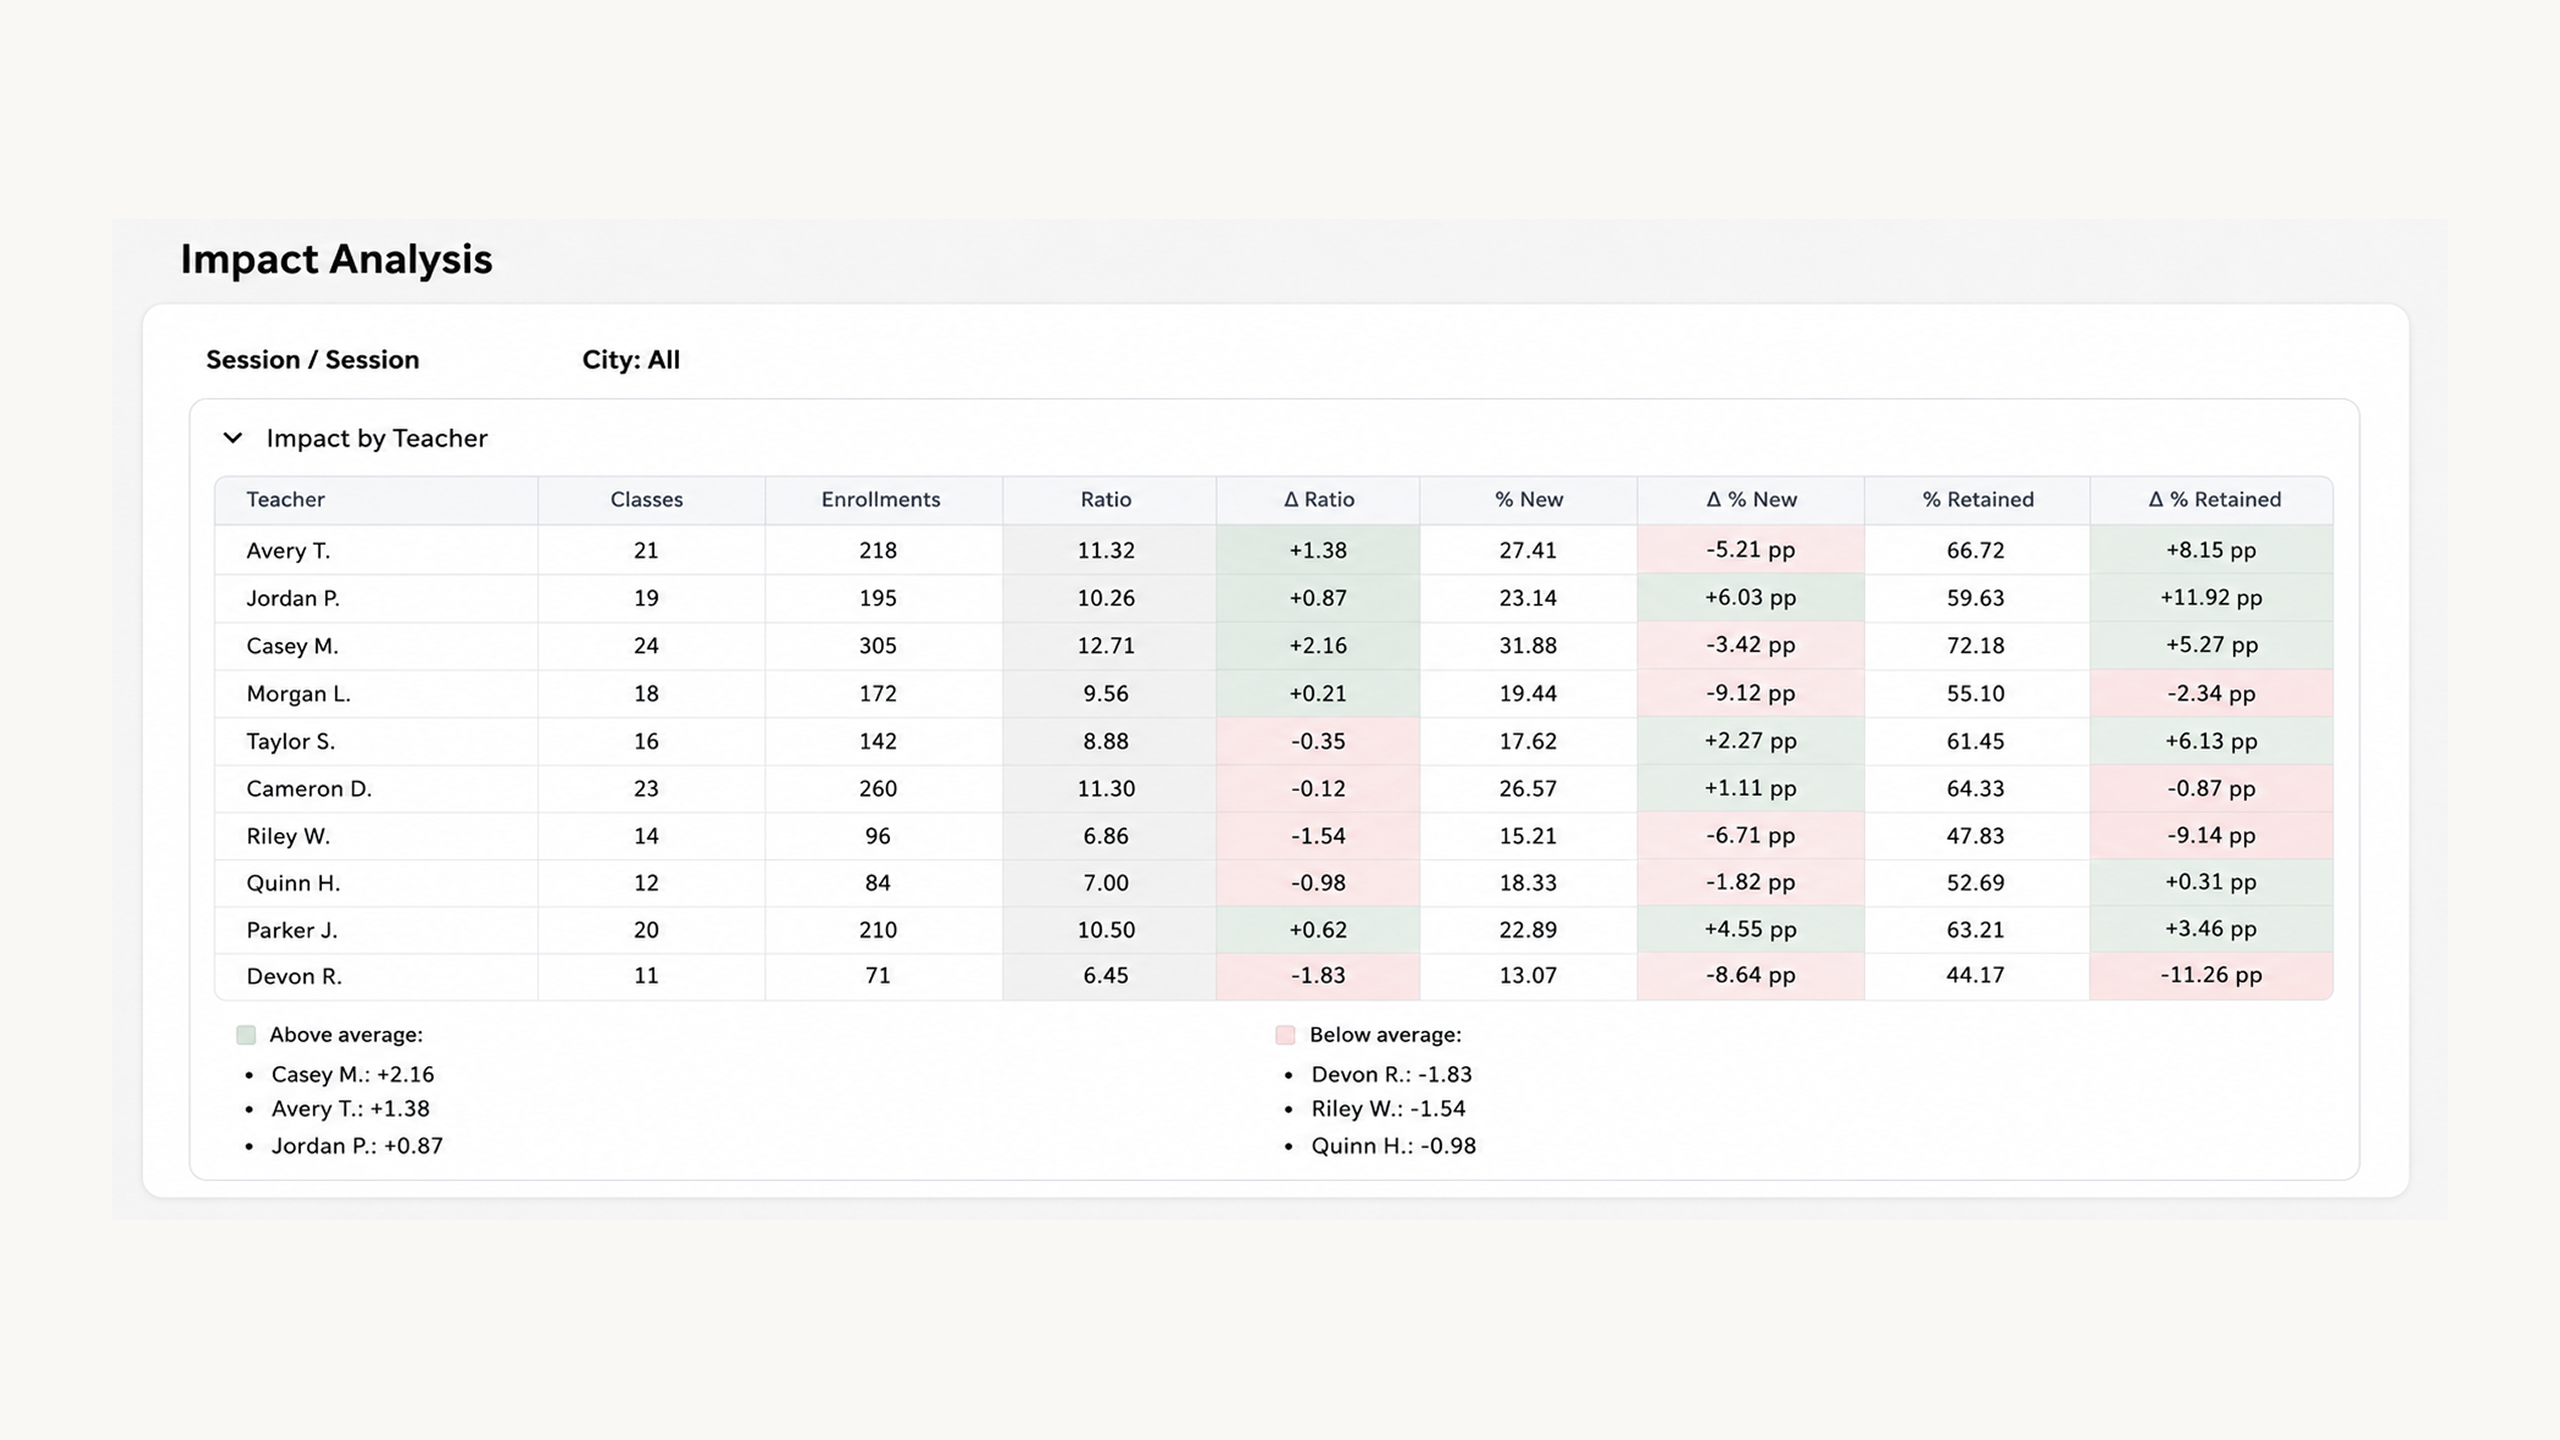
A dashboard showing how staffing and scheduling decisions affect enrollment across three views: historic, year over year, and session over session.
Measures: enrollment ratio, split into new, returning, and retained students.
Compared by: class, teacher, age, time, and day of week.
In progress — 8 locations selected as starting points for testing, with the goal of bringing every location up to par. Results pending.
Staffing and scheduling decisions are now made against session-over-session evidence instead of year-end gut checks.